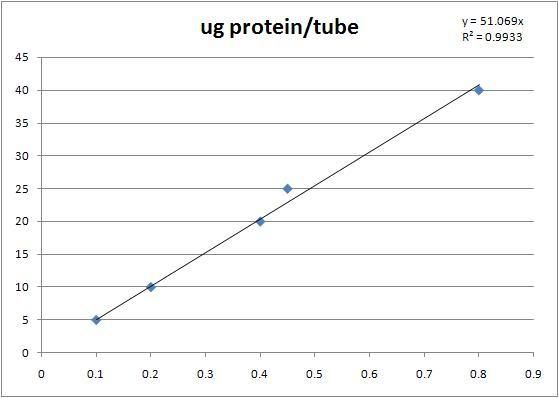
While teaching undergraduate labs in graduate school, we reinforced the principle of being able to make a relevant comparison. The students were asked to analyze the protein content of tissues using various biochemical measurements in this particular example using an external standard.
After diluting a standard of 1mg/ml protein, they performed the analysis and calculations in order to produce a standard curve. The following represents a typical standard curve:

The students would then test their unknowns and compare them to this standard curve.
As luck would have it, the samples to be tested all had protein contents WAY outside the range of the curve they created. Some students foolishly extrapolated the data assuming it to be linear out to whatever value they obtained, ignoring the possibility that outside this range the curvealinear relationship observed might not hold true. We forced them to dilute their samples until the readings fell inside those covered by the standard curve and they could give an accurate number and then scale it back up using their dilution ratio.
When you project behavior beyond the measured realm, you lose all scientific credability. In economics, they continually remind you that "past performance does not guarantee future results", and in science we can only say what we have observed, not what we expect. That is a hypothesis, not data for a conclusion, so any projection represents what we THINK will be rather than what we know. This serves relevant point in politics I may address later on my other blog. It is not actually something we have measured, and represents not fact but conjecture and assumption.
Global warming advocates do this all the time. They project outside the range and extrapolate over a wide range of time and scale, the particulars of their experiment notwithstanding. Other scientists also like to apply measurements to things outside the scale and scope and make sweeping gestures which are not necessarily true.
When working on volatile compounds in grapes, the first thing I did was establish the linear detection limits for the GC/MS protocol I used. I was able for most compounds to detect them linearly to 4ppb, which is very important since the amount of volatile is not necessarily proportional to its importance or potency. Sometimes it is RELATIVE amount that makes all the difference. Even in a linear scale then, it might take 4000ppb to register a difference from 4ppb.
The proof is in the data. When scientists make broad sweeping claims across a vast array of possibilities in clime, scale, age, time, etc., I raise an eyebrow and my hand to inquire. More often than not, this error is also accompanied by another error and my next subject- economy of scale.

No comments:
Post a Comment